Want to know how to connect social media data across platforms? Here's the short answer: align metrics like engagement, reach, and sentiment from platforms like Facebook, Instagram, LinkedIn, and TikTok to get a unified view of your campaigns. This process helps you spot patterns, compare performance, and allocate budgets effectively.
Key Takeaways:
- Step 1: Export data from each platform’s analytics tools (e.g., Meta Business Suite, LinkedIn Analytics).
- Step 2: Use tools like Socialinsider or Brandwatch to consolidate and analyze data.
- Step 3: Standardize data formats and merge datasets for consistency.
- Step 4: Analyze correlations using methods like Pearson’s coefficient to uncover trends.
- Step 5: Automate reporting with social media reporting tools for actionable insights.
By correlating social media data, you can track what works across platforms, optimize campaigns, and save time with automation. Let’s dive deeper into the steps to make this process seamless.
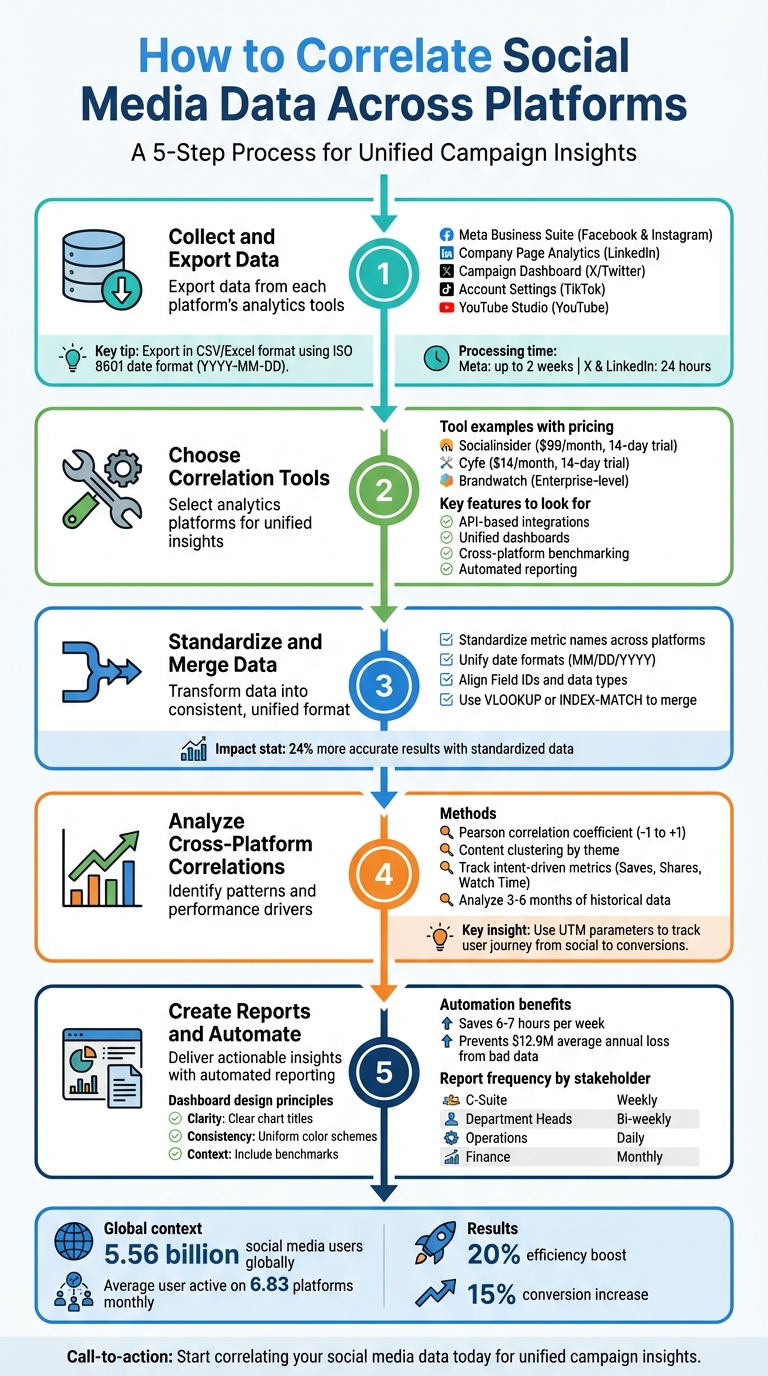
5-Step Process to Correlate Social Media Data Across Platforms
How to build your cross channel marketing analytics platform within 30 minutes - NO SLIDES
To implement this workflow, you can compare top-rated social media tools that offer the necessary API integrations and reporting features.
Step 1: Collect and Export Data from Each Platform
The first step in analyzing social media data is gathering it from all the platforms you're using. This involves accessing each platform's analytics tools and exporting the data in formats that are suitable for analysis. While it might seem overwhelming, most platforms provide user-friendly options to simplify this process.
Access Native Analytics Tools
Every social media platform has its own analytics dashboard, designed to give you insights into performance and engagement, though many teams use SocialPilot for unified analytics and scheduling. Here's a breakdown of where to find the data:
- Facebook and Instagram: Use the Meta Business Suite for organic insights and Ads Manager for paid campaign data. Make sure to customize your reports to include the metrics you need.
- LinkedIn: Data is divided between Personal Profile Analytics and Company Page Analytics. Company pages offer more detailed exports, such as viral impressions and follower source attribution, which aren't available for personal profiles.
- X (formerly Twitter): For paid campaign data, use the Campaign Dashboard. Organic data requires downloading an archive via the "Download an archive of your data" option in settings.
- TikTok: Data exports can be requested through account settings, but note that the platform provides TXT or JSON formats, which may require extra steps to make them analysis-ready.
- YouTube: The platform allows you to schedule recurring exports and save them directly to cloud services like Google Drive or Dropbox. This automation can save you time.
Keep in mind that processing times for data downloads vary. For example, Meta's data can take up to two weeks, while X and LinkedIn typically deliver archives within 24 hours. Once you've accessed the dashboards, focus on exporting your data in formats that are easy to work with.
Export Data in Standard Formats
When exporting data, aim for formats like CSV or Excel, which allow for easy manipulation and analysis. Before exporting, customize your reporting columns in tools like Meta Ads Manager or LinkedIn Campaign Manager to include critical KPIs such as ROAS (Return on Ad Spend) or CTR (Click-Through Rate). This ensures you don’t miss any essential metrics.
For consistency, use the ISO 8601 format (YYYY-MM-DD) for dates across all exports. Export your data with a "Daily Time Breakdown", so each row reflects a single day's performance. This level of detail is crucial for accurate data merging. Additionally, include unique identifiers like Campaign IDs, Post IDs, or UTM parameters - these are key to validating and combining data from different platforms.
If you’re working with LinkedIn pages that have a lot of historical data, export it in 90-day chunks to avoid system timeouts and ensure nothing gets left out. To stay organized, set reminders to export data monthly, as download links often have expiration dates.
Quick Overview of Platform-Specific Tools and Data
| Platform | Analytics Tool | Export Formats | Key Data Available |
|---|---|---|---|
| Meta Business Suite / Ads Manager | CSV, XLSX, PNG | Reach, Engagement, ROAS, Demographics | |
| Meta Business Suite / Insights | CSV, XLSX, PNG | Story views, Reel performance, Profile visits | |
| Company Page Analytics | CSV, XLSX | Follower growth, Visitor demographics, Post clicks | |
| X (Twitter) | Campaign Dashboard / Archive | CSV, JSON | Impressions, Clicks, Spend, Engagement |
| TikTok | Account Settings | TXT, JSON | Video history, Comment history, Privacy settings |
| YouTube | YouTube Studio / Google Takeout | Various (CSV/JSON) | Watch time, Subscriber growth, Traffic sources |
Step 2: Choose Tools for Data Correlation
Once you've exported your data, the next step is selecting software that brings all your insights together into a single, unified view. This eliminates the hassle of jumping between various dashboards, saving time and helping you spot patterns you might otherwise miss. To simplify your search, start by exploring well-organized tool directories.
Use Tool Directories for Research
Testing dozens of analytics platforms can be overwhelming. Instead, consider starting with Top Social Tools, a directory that organizes options based on features, supported platforms, pricing, and use cases like competitive benchmarking or sentiment tracking. It highlights essential capabilities such as AI-driven insights, automated reporting, and access to historical data - key factors for comparing campaign performance over time.
A survey conducted in September 2025 among 147 social media professionals revealed that multi-platform support and advanced features were among the top criteria when choosing analytics tools. To narrow your options, filter by the platforms you actively use, such as TikTok, LinkedIn, or Instagram, ensuring the tool can handle cross-platform data correlation effectively.
Analytics Tool Examples
Here are a few tools that excel at consolidating data across multiple platforms:
Socialinsider: This tool integrates data from Instagram, TikTok, Facebook, and YouTube into a single dashboard. It's particularly useful for competitor analysis and monitoring content performance across platforms. For instance, the agency Create Media reported saving more than $16,000 annually by automating their monthly reports with Socialinsider. Victor Mukubvu, a Digital Marketing Analyst at Mitsubishi Electric, shared:
"Socialinsider's competitor analysis dashboard helped in creating visibility on how we are performing in the market".
Plans start at $99/month and include a 14-day free trial.
Brandwatch: Designed for enterprise-level users, Brandwatch specializes in sentiment analysis and social listening. It uses AI to track brand mentions across millions of sources, making it invaluable for correlating paid campaign performance with public sentiment beyond your owned channels.
Cyfe: This tool allows for custom KPI tracking by combining data from various apps, such as Salesforce and Facebook, into unique insights. Known for its quick setup (ready-to-use in under five minutes) and white-label reporting features, Cyfe starts at just $14/month for one user and also offers a 14-day free trial.
When choosing a tool, focus on those with API-based integrations, as they ensure accurate, real-time data updates. Look for features like unified dashboards, cross-platform benchmarking, and tools to estimate the monetary value of organic efforts. These capabilities are essential for effectively communicating ROI to executives. Many platforms offer free trials ranging from 14 to 30 days, giving you the chance to test their compatibility with your workflow before making a commitment.
Step 3: Standardize and Merge Data Across Platforms
Now that you've exported your data and picked your correlation tools, it's time to unify everything into a single dataset for better analysis. The challenge? Different platforms often use inconsistent naming conventions, date formats, and metric definitions. Without a consistent approach, you might end up comparing apples to oranges.
Standardize Metrics and Formats
Start by defining a clear data model with set rules for every field. This means deciding on consistent data types (e.g., storing phone numbers as integers instead of strings), using a unified date format like MM/DD/YYYY for U.S. audiences, and standardizing metric names across platforms. Pay attention to categorical values too - convert variations like "F" and "Female" into a single label. Similarly, ensure location data is consistent, such as mapping "USA" and "United States" to a single term.
Ehsan Elahi, Director of Operations at Data Ladder, explains:
"Data standardization is the process of transforming an incorrect or unacceptable representation of data into an acceptable form."
Standardized data can make a huge difference. A study by Enterprise Content Solutions found that matching standardized records produced 24% more accurate results compared to inconsistent data. To maintain consistency, schedule daily checks for formatting, investigate anomalies weekly, and audit your validation rules monthly.
Once your data is standardized, it’s ready to be merged without any headaches.
Merge Data from Multiple Platforms
A unified dataset lets you perform cross-platform analysis without running into discrepancies. After standardizing your data, you can merge it using tools like Google Sheets or Excel. The trick is ensuring that dimensions across datasets share identical Field IDs and data types. For example, aligning Field IDs makes it easier to combine and visualize data seamlessly.
Narrow down each dataset to only the relevant information - for instance, filtering GA4 records to focus on "social" traffic. Use functions like VLOOKUP or INDEX-MATCH with shared keys (such as dates or campaign names) to blend metrics. To save time, automate data pulls with time-based triggers in Google Apps Script. This way, your datasets stay up to date with minimal manual effort.
sbb-itb-b3cfc51
Step 4: Analyze Cross-Platform Correlations
Now that you've got your unified dataset, it’s time to dig into the connections between platforms. The goal here is to identify the factors driving performance. This means moving past surface-level metrics and uncovering the deeper correlations that influence your results.
Correlation Methods and Tools
One effective way to measure relationships between datasets is the Pearson correlation coefficient. This statistical method quantifies the linear relationship between two variables, with results ranging from –1 (perfect negative correlation) to +1 (perfect positive correlation). A result of 0 means no correlation at all. For example, you might discover that higher engagement on one platform coincides with increased website traffic, signaling a strong positive link.
To simplify this process, leverage tools that have built-in correlation features. These tools often include AI content creation tools for clustering, competitive benchmarking, and cross-platform reporting. They also provide visual aids like heatmaps to display audience activity across networks. Many of these tools offer free trials, letting you test their capabilities before making a commitment. Once you’ve identified statistical correlations, dive deeper into content trends to fine-tune your approach.
Identify Cross-Platform Trends
Start by grouping your posts into thematic categories - such as educational content, humorous posts, or product promotions. This helps you pinpoint which topics resonate best on each platform. For instance, in 2025, Slack’s social media team, led by Haley Rivet, found that "career and recruiting" content performed exceptionally well on LinkedIn. This insight led them to integrate more career-focused advice into their strategy. Similarly, in September 2025, the B2B SaaS company tldv.io used workplace humor in Instagram Reels, resulting in a viral hit. One Reel alone amassed over 3.4 million views and 90,000 likes.
Instead of chasing vanity metrics like likes, focus on intent-driven actions. On Instagram, for example, "Saves" and "Shares" are more meaningful indicators of audience engagement. For video content on platforms like TikTok and Instagram Reels, metrics such as "Average Watch Time" and "Completion Rate" can reveal whether your hooks are compelling enough to keep viewers watching.
Kate Meyers Emery, Sr. Digital Manager at Candid, emphasizes the importance of qualitative data:
"Qualitative data adds to the broader picture of what is happening with your social media platforms... It helps explain why content analytics may be higher or lower."
Historical data is another critical piece of the puzzle. By analyzing trends over at least three to six months, you can differentiate between one-off viral moments and consistent growth. As Anda Radulescu, Content Writer at Socialinsider, explains:
"Historical data uncovers long-term performance patterns, helping you anticipate trends instead of reacting to short-term spikes."
Finally, make sure to use UTM parameters on all your social links. This allows you to track the user journey from specific platforms to website conversions, giving you a clear view of how social media activity ties into your business outcomes.
Step 5: Create Reports and Automate Insights
Once you've merged and analyzed your cross-platform data, the next step is delivering insights that can guide strategic decisions. This involves creating dashboards that showcase your findings and setting up automation to minimize repetitive tasks. By automating reports, you can consistently provide actionable, data-driven insights.
Design Unified Dashboards
Start by identifying your audience. For example, C-suite executives typically need high-level insights, such as ROI and overarching trends, while your social media team will require detailed metrics like content performance and campaign results. Tailor the complexity of your dashboard to meet the needs of each group.
When building dashboards, keep the Three C's in mind: Clarity, Consistency, and Context. Use clear titles for every chart, maintain a uniform color scheme across reports, and include context like benchmarks or comparison periods. Organizing data by platform or campaign allows users to quickly assess performance. Also, be mindful of date formats - platforms like Facebook and LinkedIn operate on different time zones (e.g., Pacific Time vs. Eastern Time). Document these variations for consistency.
To make metrics more relatable, consider using monetary proxies. For instance, some tools offer an "Organic Value" metric, which estimates the dollar value of organic results if achieved through paid ads. This approach helps translate social media performance into terms that resonate with financial teams and executives.
Don’t forget to include qualitative insights, such as screenshots or user comments. These can complement quantitative data and provide a fuller picture of audience sentiment.
For agencies or teams managing multiple clients or departments, white-labeling can be a game-changer. Tools that support custom branding, logos, and color schemes allow you to maintain a professional look. You can also share live dashboards via public links, enabling viewers to comment directly.
Export Automated Reports
After setting up your dashboards, automate your reporting to ensure consistent and timely insights. Manual reporting is not only time-intensive but also prone to errors. Automating this process can save your team roughly 6 to 7 hours per week. Additionally, poor data quality can be costly - businesses lose an average of $12.9 million annually due to bad data, so reliable automation is a smart investment.
Use API-based integrations to streamline data consolidation. Many tools can connect to over 30 data sources, delivering reports straight to your email inbox.
Schedule automated reports based on stakeholder needs:
- C-Suite: Weekly updates focusing on key KPIs and overall business impact.
- Department Heads: Bi-weekly reports covering department-specific metrics and campaign updates.
- Operations Teams: Daily reports with real-time performance data and community engagement stats.
- Finance: Monthly summaries highlighting ad spend ROI and financial performance.
Be sure to document attribution windows in your reports. For instance, Facebook typically uses a 28-day attribution window, while LinkedIn operates on a 90-day window. Clearly noting these differences helps explain any variations in conversions across platforms.
Additionally, set up real-time alerts for critical metrics. Social listening integrations like Brand24 can notify you of spikes in mentions or shifts in sentiment, allowing you to address issues before they escalate. This immediate feedback loop reinforces the reliability of the data you've worked to establish.
If you're unsure which tools to use for automation and reporting, check out resources like Top Social Tools to find options tailored to your needs.
Conclusion
Bringing together social media data creates a clear, unified picture of your campaigns. Instead of dealing with scattered insights, you can connect social activity directly to tangible results like signups and revenue.
The advantages are measurable. For instance, advanced marketing intelligence platforms can boost efficiency by 20% and increase conversions by 15%.
Here’s how to simplify the process: gather native data, standardize it, analyze cross-platform connections, and automate reporting to ensure consistent, up-to-date insights.
This process builds on the strategies discussed earlier. If you’re searching for tools to make this workflow easier - from data collection and validation to automated reporting and AI-driven insights - check out Top Social Tools. Their platform includes filters for specific needs like analytics, monitoring, and automation, helping you find the right fit for your goals and budget.
With 5.56 billion people using social media globally and the average user active on 6.83 platforms each month, cross-platform correlation isn’t just helpful - it’s essential for staying ahead and making smarter marketing investments.
FAQs
How can I maintain consistency when combining social media data from different platforms?
To ensure consistency when working with social media data, the first step is to standardize metrics and formats across platforms. Social media platforms often use unique terms and measurements, so aligning these into a common set of indicators is key to making the data comparable and easy to analyze.
Using data mapping tools can make this process much smoother. These tools can automatically translate different naming conventions and measurement units, saving time and reducing errors. On top of that, it’s important to validate your data regularly. Techniques like format checks, range validations, and cross-field comparisons are great for catching errors or inconsistencies, ensuring the data stays accurate and complete.
For the most reliable results, combine automated tools with periodic manual reviews. This mix ensures the data you’re using for campaign analysis and decision-making is both accurate and trustworthy.
What are the top tools for automating social media reporting across platforms?
When it comes to simplifying social media reporting across various platforms, tools that combine data from multiple sources into one dashboard can be a game-changer. These tools often come with features like automated updates and customizable reports, making it easier to analyze performance without spending hours compiling data manually.
By using these tools, you not only save time but also gain clear insights that help fine-tune your campaigns. Depending on your goals, you can choose solutions focused on analytics, engagement tracking, or campaign performance monitoring. The key is to find a tool that aligns with your specific needs and makes reporting less of a chore.
How can I track and evaluate the success of my social media campaigns across different platforms?
To keep tabs on your social media campaigns across different platforms, start by focusing on key metrics like engagement rates, reach, impressions, follower growth, and brand sentiment. These numbers reveal how well your content is doing and how users are interacting with your brand on each platform.
To make tracking easier, use analytics tools that pull data from multiple platforms into one place. This gives you a clear, unified view of your campaign's performance. You might also want to use multi-touch attribution models to figure out how each platform plays a role in reaching your overall goals. This way, you can fine-tune your strategy based on what’s working.
By combining a data-driven mindset with the right tools, you’ll be able to measure, compare, and tweak your campaigns for better outcomes.